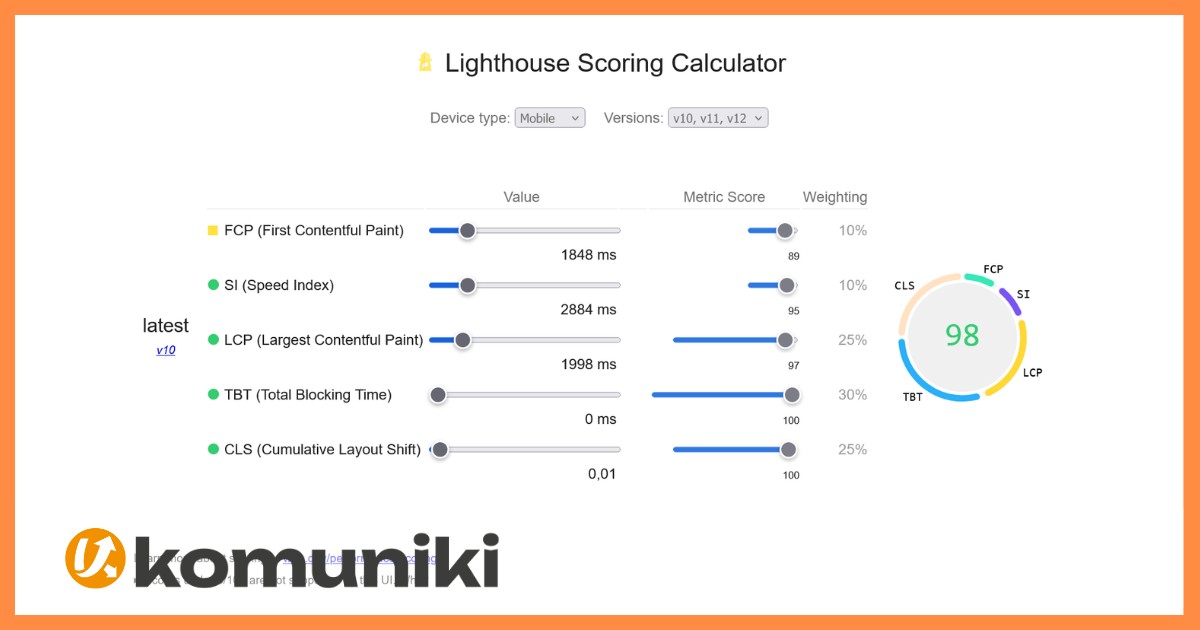
In short: finding out whether your website is fast takes just a few minutes. Enter the URL in a tool based on Google PageSpeed Insights, look at the three values that really matter (LCP, INP and CLS) and start with the most common causes: heavy images, too many scripts, sliders, slow hosting. The 0–100 score is just a summary: what matters is understanding why the site is slow and what to fix first.
A slow website isn’t just a technical problem. It’s a communication and sales problem: people leave before reading what you offer, Google sees it as a worse experience, and AI agents find it harder to read too. In this guide we look at how to run a proper analysis, how to read the results without getting lost in acronyms, and where to start.
Why website speed matters so much
- Enquiries and sales: every extra second of waiting increases the number of people who close the page, especially on mobile.
- Google rankings: Core Web Vitals are part of the page experience signals Google takes into account.
- Brand image: a site that freezes or “jumps” while loading looks careless, even if the content is excellent.
- Visibility in AI: stable, lightweight pages are also easier for AI agents to read.
The three numbers that really matter
Google measures the loading experience with three indicators, the Core Web Vitals. These, not the overall score, tell you what’s really going on.
LCP: how long the main content takes to appear
Largest Contentful Paint measures how long it takes for the largest element on the page to show, usually the main image or the headline. It’s the moment visitors feel the site has “arrived”. Target: under 2.5 seconds.
INP: how responsive the site is when you use it
Interaction to Next Paint measures how quickly the site reacts to clicks, taps and typing. Since 2024 it has replaced the old FID. If a menu or button responds with a delay, INP is high. Target: under 200 milliseconds.
CLS: how much the page “jumps” while loading
Cumulative Layout Shift measures sudden movements of elements: text that drops when an image arrives, a button that moves just as you’re about to tap it. Target: under 0.1.
Lab data and real-world data: what’s the difference?
PageSpeed Insights shows two types of data:
- Real-world (field) data: comes from Chrome users who visited your site over the last 28 days. It’s the most reliable, but it only appears if your site gets enough traffic.
- Lab data: a simulation run on the spot, always available. It’s useful for finding causes, but it can vary a little from one test to the next.
If you have both, base decisions on the real-world data and use the lab data to work out what to fix.
Why the mobile score is lower
The mobile test simulates a mid-range phone on a slow 4G connection, not your phone on home Wi-Fi. It’s the toughest test, but also the closest to how most people experience your site. And Google indexes the mobile version first, so that’s the one to improve first.
How to run the analysis in 3 minutes
- Open Komuniki’s free website audit and enter the URL of the page you want to check (not just the homepage: try a service page or a product page too).
- Look at the mobile result first, then desktop.
- Check LCP, INP and CLS: which one is red or orange?
- Get the PDF report by email, with the causes explained in plain language and the order in which to tackle them.
The most common causes and what to do
- Images that are too heavy: the number one cause of slow LCP. Resize them to their real display size, use modern formats like WebP or AVIF, and lazy-load the ones further down the page.
- Sliders at the top of the page: they load more images and scripts than needed and often make LCP and CLS worse. We cover this in our guide on sliders and website speed.
- Too many plugins and scripts: chat widgets, tracking pixels, maps, social widgets. Every external element slows things down and hurts INP. Keep only what you really need.
- Fonts and images without dimensions: they cause layout shifts. Always set image width and height, and load fonts efficiently.
- Slow hosting: if the server responds slowly, no optimisation is enough. Suitable hosting is the foundation.
- Missing or badly configured cache: caching helps a lot, but it isn’t magic. It serves the page faster; it doesn’t make it lighter.
If you run an online store, also read how to optimise a WooCommerce store.
Quick checklist
- ☐ Tested on mobile, not just desktop
- ☐ LCP under 2.5 seconds on key pages
- ☐ INP under 200 milliseconds
- ☐ CLS under 0.1
- ☐ Images resized and in WebP or AVIF
- ☐ No heavy sliders at the top
- ☐ Only the plugins and scripts you really need
- ☐ Caching on and suitable hosting
- ☐ Re-test after every major change
When it’s worth getting help
Many fixes, like image optimisation, take an afternoon. Others, like a heavy theme, a script that blocks the page or a slow server, need technical skills. At Komuniki, speed is part of a broader approach to WordPress development and SEO and GEO: a fast website communicates better, ranks better and converts more.
Want to know how your site is doing? Run the free audit now: you’ll get the report by email, with no sign-up.
Frequently asked questions
My site scores 40/100: is that bad?
It depends on the cause. A 40 caused by heavy images can be fixed quickly; a 40 caused by the server or a poorly built theme takes more work. That’s why the number alone isn’t enough.
Do I need to reach 100?
No. The goal is to have LCP, INP and CLS within the recommended values on your important pages. Beyond a certain point, the benefit for visitors is minimal.
Every test gives a different result: is that normal?
Yes, lab data can vary by a few points between tests. Look at the trend and, if available, at real user data.
Is a caching plugin enough?
It helps, but it isn’t enough. Caching serves the page faster, but a heavy page stays heavy. You also need to work on images, scripts and hosting.